NFL Cost Per Stat: Who Are the Most Undervalued and Overvalued Players?
It’s no secret fame comes with a pretty penny. Being in the limelight means bringing home a salary to match the expectations from the public: hefty.
Professional sports are among the highest paying careers, with many arguing athletes make significantly too much money. While NBA players generally bring in the highest salaries each year worldwide — with an average annual salary of $8.32 million in 2019-20 — the NFL doesn’t fall far behind with an average yearly salary of $3.26 million. Compared to the mere $68,703 median household income for Americans in 2019, NFL players are doing pretty well.
Given the high salaries and expensive tickets to attend games, does the NFL have a good return on investment (ROI)? Experts investigated which NFL fans get the most for their money and found the Carolina Panthers offered the best ROI. But what about ROI for players?
With some active roster rookies signing the minimum, a $610,000 one-year contract, and top players bringing in tens of millions, how do NFL salaries stack up to each athlete’s performance? We used detailed player salary data to compute the cost per pass, yard gained, various defensive statistics, scoring kick, and touchdown to see which teams and players have the greatest ROI and offer the most value.
Million-Dollar Pass
Quarterbacks have always been the NFL’s most prized possession, and their salaries reflect that.
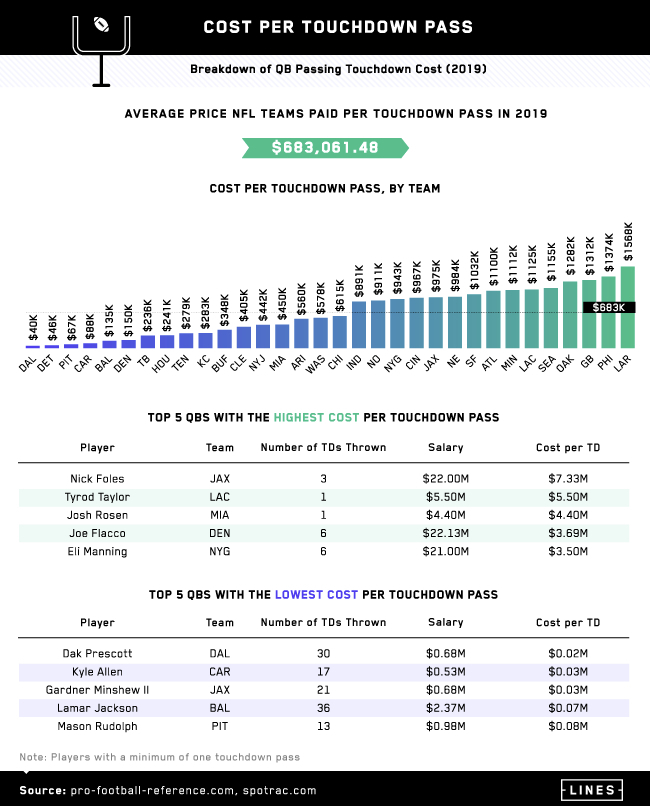
Players in the lead position typically make significantly more than their teammates, like Patrick Mahomes racking in an average annual wage of $45 million and a guaranteed $141 million contract. Despite making the most money and coming out on top with a 2019 championship win, the Kansas City Chiefs were not the team with the lowest or highest cost per quarterback touchdown pass. Instead, the Dallas Cowboys paid the lowest per passing touchdown, spending just $40,000 for each in 2019. The Detroit Lions, Pittsburgh Steelers and Carolina Panthers also spent under $100,000 per passing touchdown.
In contrast, the Los Angeles Rams spent nearly 15 times more, coming in at $1.6 million per touchdown pass.
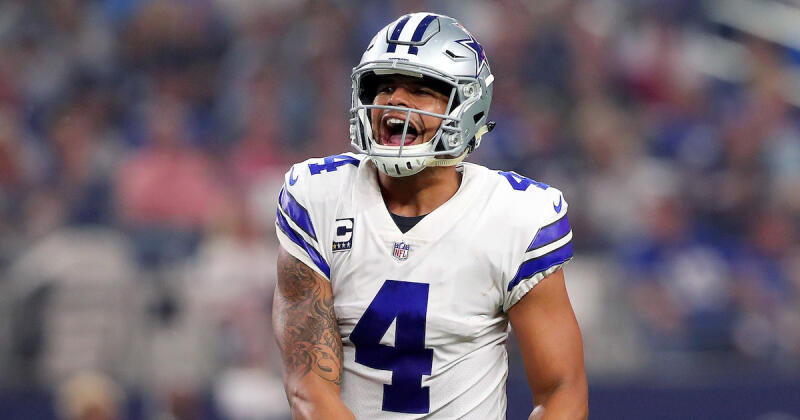
The discrepancy in cost per touchdown is also seen when looking at specific players. In 2019, Jaguars' Nick Foles had the highest price per touchdown, with his team spending $7.33 million for each of his three touchdown passes. On the other hand, the Cowboys’ Dak Prescott added the greatest value, with each of his 30 passing touchdowns costing only $20,000.
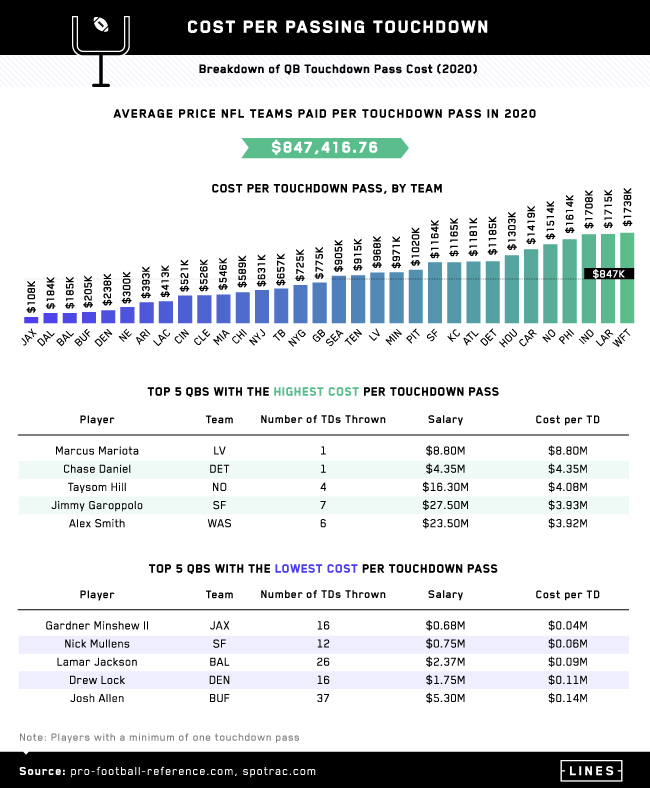
However, these numbers changed drastically in 2020. The average price NFL teams paid per touchdown increased by a whopping $164,000.
In an unexpected twist from the previous year, the Jacksonville Jaguars had the lowest cost per touchdown, with each costing $108,000, while the Washington Football Team spent over $1.7 million per touchdown. Marcus Mariota became the quarterback with the highest price per passing touchdown; his single touchdown cost the Raiders $8.8 million.
Replacing Prescott’s top spot and counterbalancing the Jaguars’ costly QB investment from 2019, Gardner Minshew had the most bang for his buck, costing just $40,000 per each of his 16 touchdowns.
Gains Come at a Cost
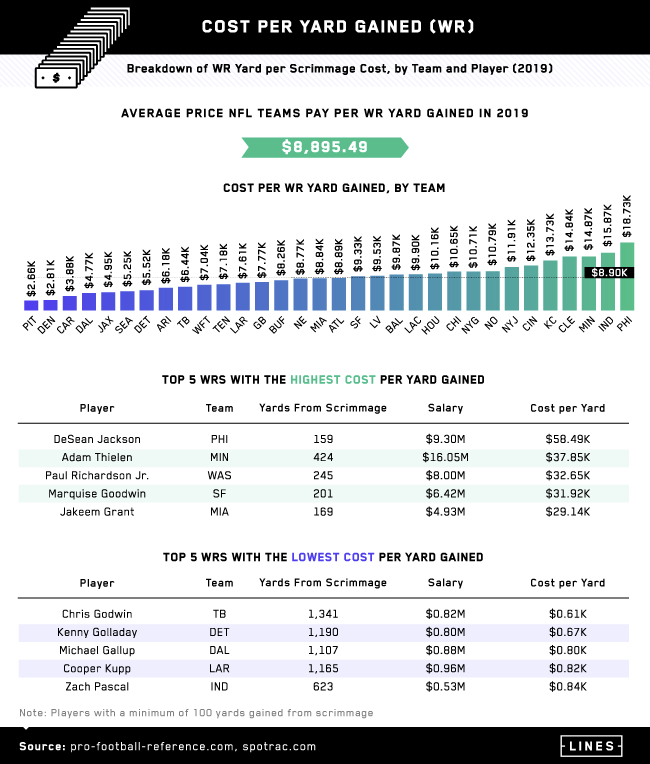
Entering the 2020 NFL season, Julio Jones of the Atlanta Falcons raked in the highest average annual salary of $22 million and had the third-highest receiving yards. But in 2019, the Atlanta Falcons landed precisely in the middle of cost per yard gained by wide receivers.
With an average price of $8,895.49 paid by NFL teams per yard gained, the Falcons totaled just that figure, spending an average of $8.89K per yard. The Steelers spent the least, with each yard gained by a wide receiver costing $2.66K, while the Philadelphia Eagles spent the most at nearly $19,000 per yard.
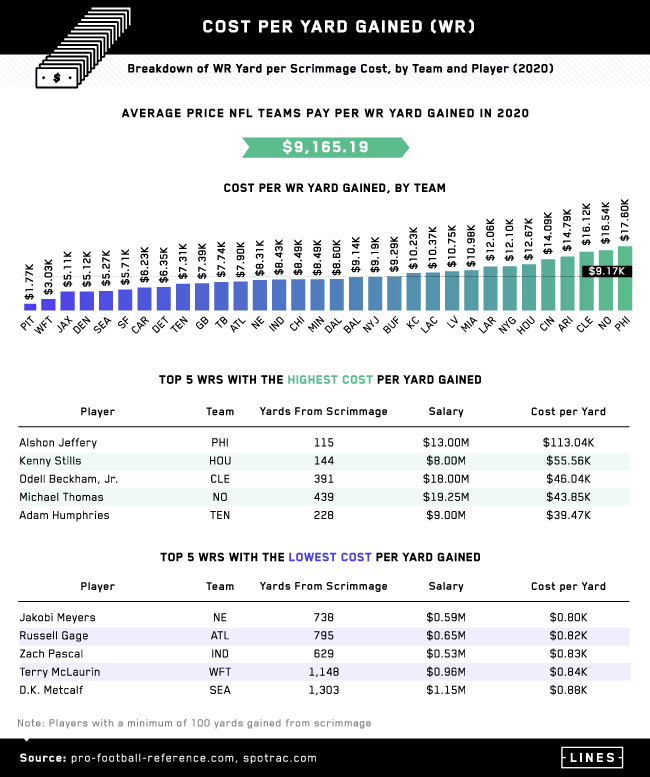
Unlike cost per passing touchdown, the difference between the cost per yard gained in 2019 and 2020 barely changed.
In 2020, the average payment per yard gained was $9,165.19, with the Steelers still paying the least and about $1,000 less from the previous year, at $1.77K per wide receiver yard gained and the Eagles still paying the most at $17.6K per wide receiver yard gained.
The Longest Yard
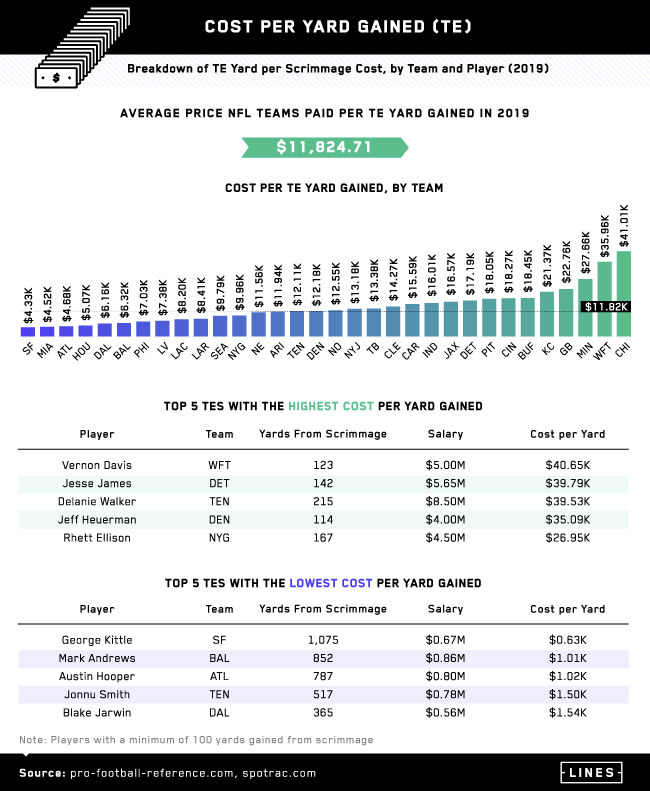
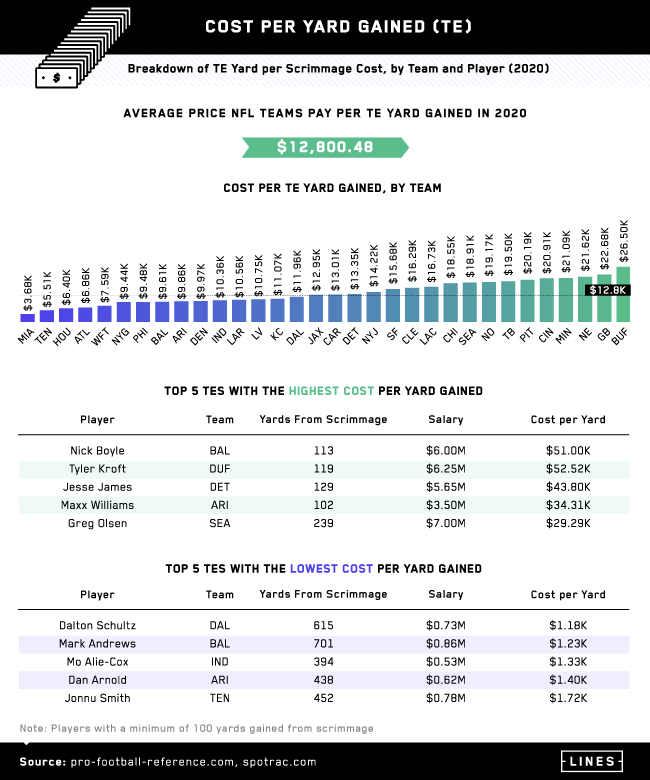
Tight ends are a hybrid position, often having two jobs in one: act as an offensive lineman and as a wide receiver. Thus, they often gain significantly fewer yards than wide receivers and tend to make slightly less. However, the salary difference isn’t enough to offset the cost per yard gained, with the average totaling $11,824.71 in 2019 and $12,800.48 in 2020.
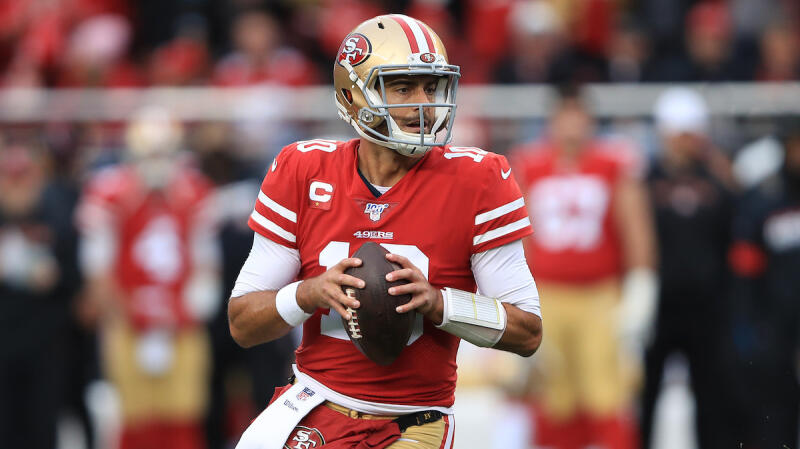
On the cheaper side, the San Francisco 49ers spent just $4.3K per yard gained by tight ends in 2019, followed by the Miami Dolphins ($4.5K) and Atlanta Falcons ($4.68K). On the other hand, the Chicago Bears spent the most, with each yard gained costing a whopping $41.01K. The Washington Football Team came in a close second, spending nearly $36,000 per yard gained.
In 2020, the San Francisco 49ers saw a drastic increase in price per yard gained, spending $15.68K a yard, thanks to a contract extension for tight end George Kittle. The Chicago Bears cut their cost per yard by more than half, spending around $22K less than the year prior. Replacing the Bears at the top, the Buffalo Bills spent the most per yard gained, with a total of $26.5K spent per tight end yard gained.
Looking at players, value changed drastically. In 2019, Kittle was the most valuable tight end in terms of cost per yard gained. Gaining 1,075 yards with a salary of $670,000, the 49ers spent just $630 per yard gained by Kittle. However, in 2020, Dalton Schultz became the tight end whose yard gains cost the least. With a total of 615 yards gained and a $730K salary, the Dallas Cowboys spent just nearly $1.2K per yard gained by Schultz.
Running Back ROI
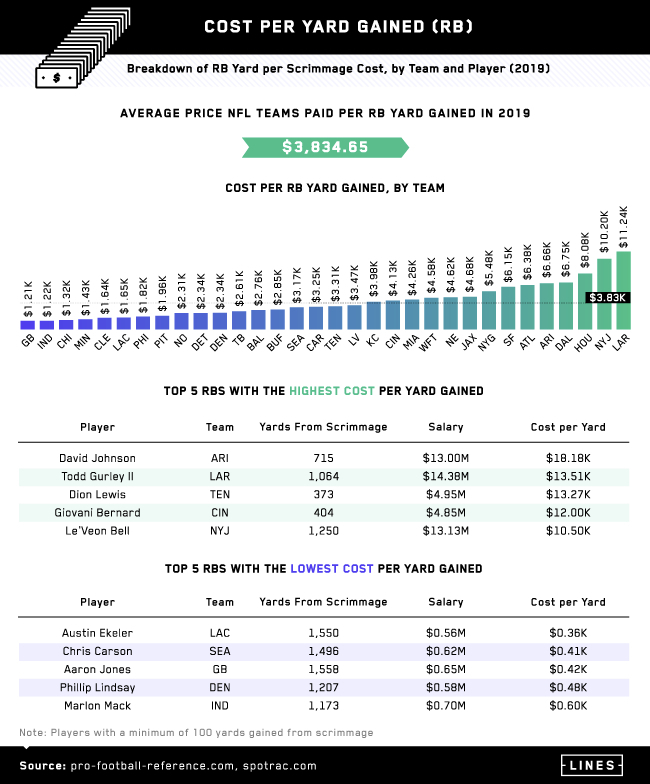
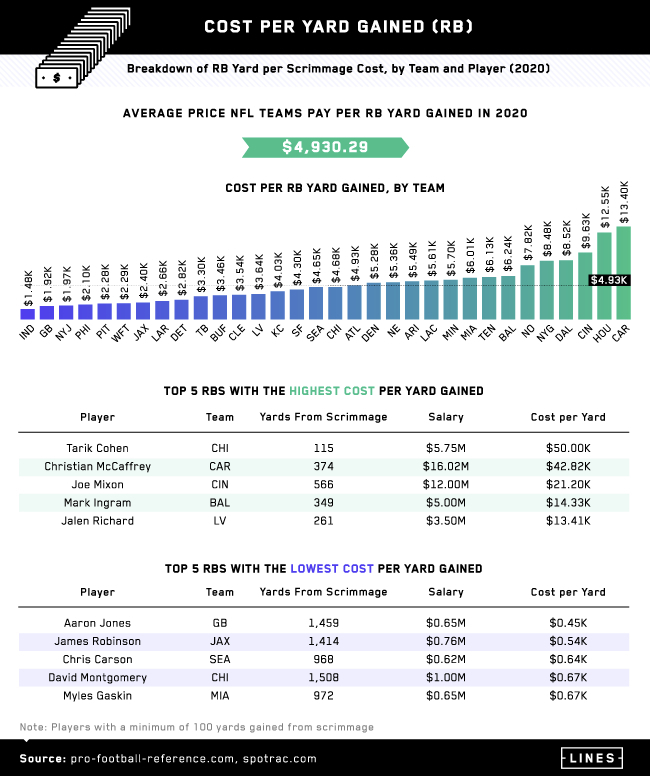
Across all statistics thus far, yards gained by running backs were by far the least expensive. On average, the cost per yard gained by running backs in 2019 was $3,834.65, rising by nearly 30% to $4,930.29 in 2020.
While the Los Angeles Rams spent the most, totaling $11.2K per yard, the Green Bay Packers spent a fraction of that: just $1.2K per yard. Aaron Jones of the Green Bay Packers represented his team on the top five running backs with the lowest cost per yard gained, with each of his 1,558 yards costing just over $400. Despite Jones’ relatively low salary of $650K, Packers players who earned the most earned their keep in 2019.
The following year saw slight changes. the Green Bay Packers gave up their spot as the team spending the least on yards gained by running backs, but only fell one spot. To make up for the slight loss, Aaron Jones became the running back with the lowest cost per yard gained in 2020, with 1,459 yards costing just $450 each.
On the Defense
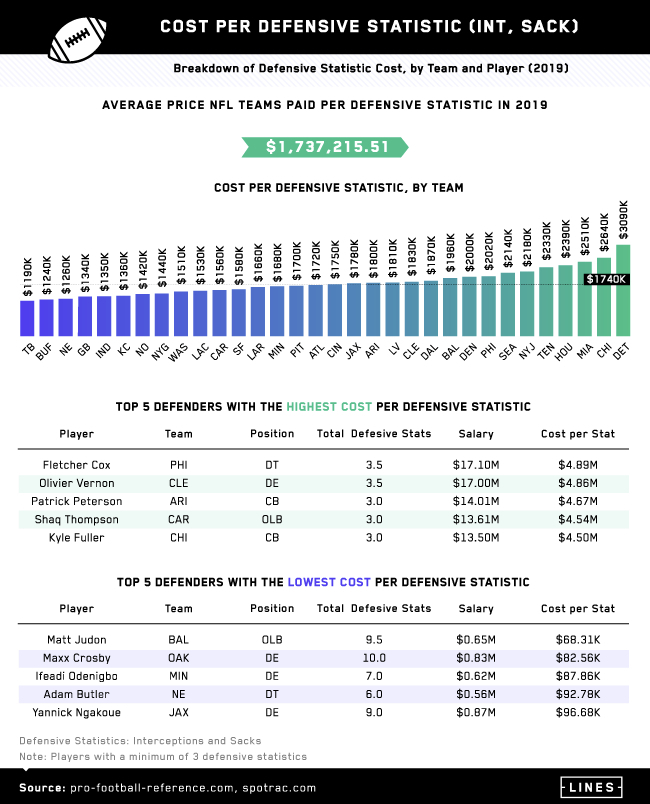
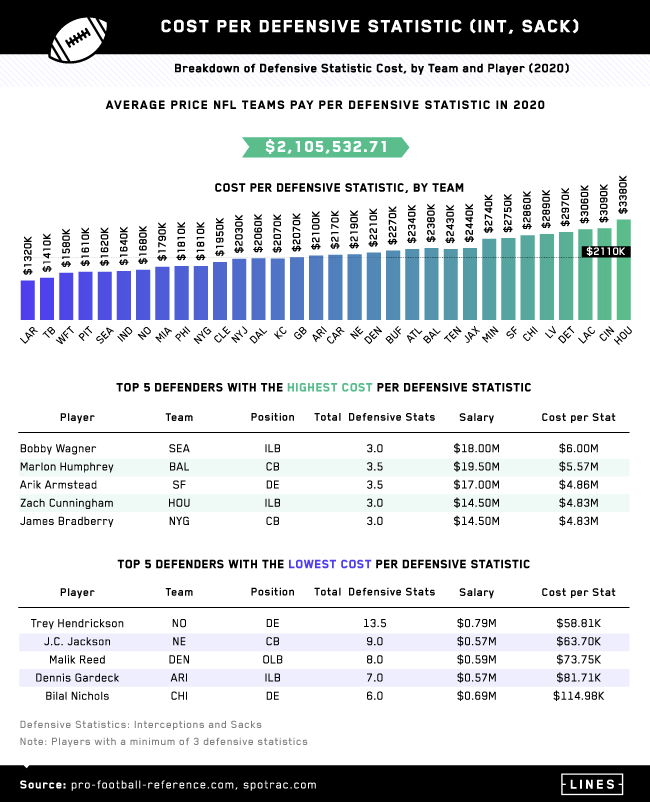
Defensive statistics (specifically interceptions and sacks) cost NFL teams the most.
On average, defensive stats cost NFL teams nearly $1.7M in 2019, jumping to over $2.1M in 2020.
Additionally, particular teams’ spending across the years changed drastically between the years. Defensive stats for the Buffalo Bills cost $1.24 million in 2019, while the same moves cost the team $2.27 million in 2020. On the contrary, defensive stats cost the Miami Dolphins a whopping $2.51 million in 2019, but only about $1.79 million in 2020.
Some things that stayed consistent from 2019 to 2020 were the Tampa Bay Buccaneers’ low cost per defensive statistic and the Detroit Lions and Houston Texans’ highest cost per defensive statistic.
Kicking Down Costs
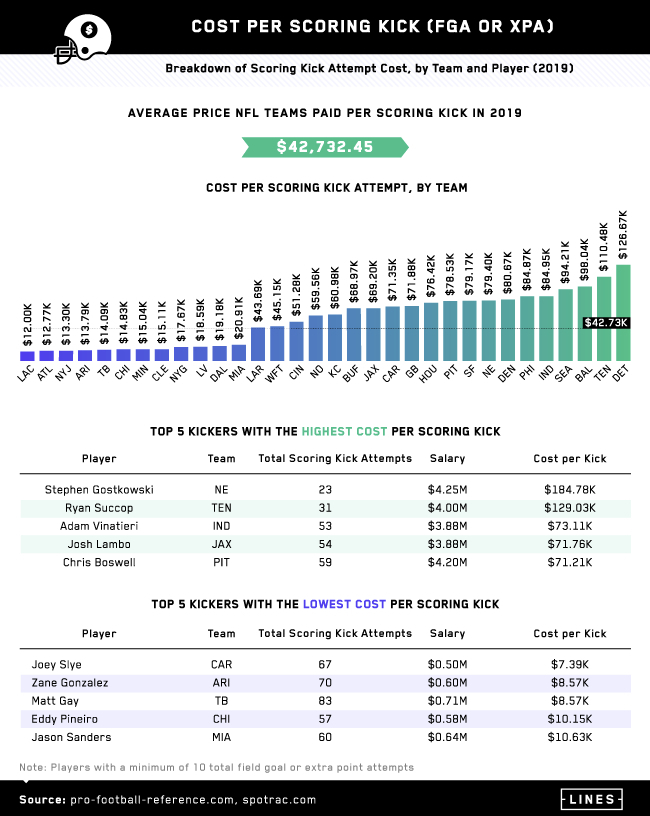
Despite much of the focus resting on the quarterback and player scoring a touchdown, kickers play a crucial role in winning – accounting for nearly a third of scoring in the NFL. However, scoring kicks cost a substantial amount in 2019.
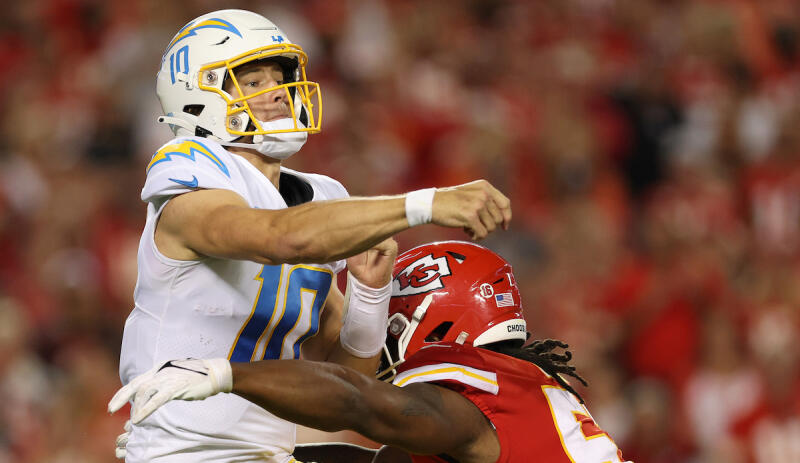
On average that year, a scoring kick cost $42,732.45, with kicks from the Detroit Lions costing the most. Compared to a $12K price tag for Los Angeles Chargers kicks, a scoring kick cost the Detroit Lions nearly $127K.
In that same year, Stephen Gostkowski’s kicks cost the New England Patriots the most by far. Coming in at nearly $185K per kick, Gostkowski’s kicks cost over $50K more than the next top player, Ryan Succop.
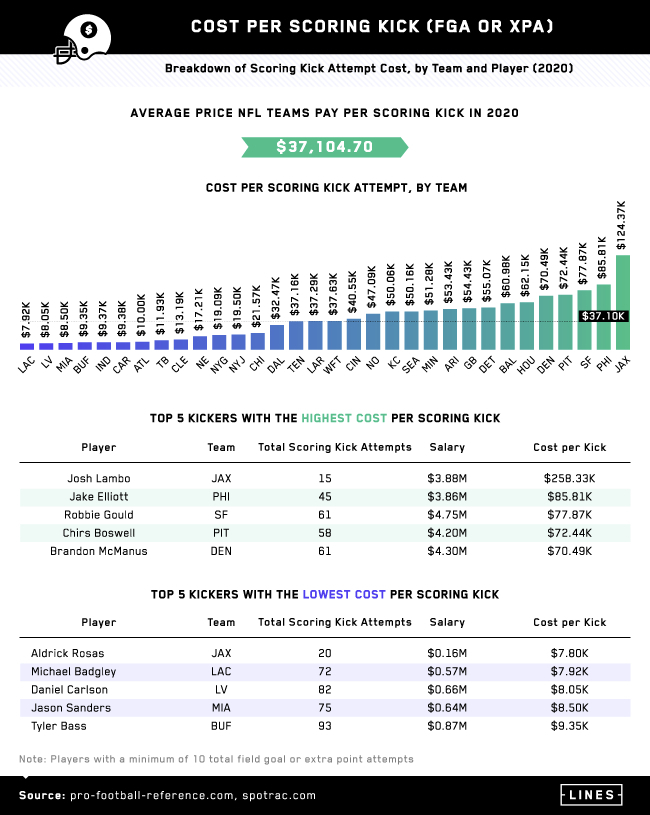
The following year saw a stark decrease in cost per kick – both on average and for the top kickers with the highest cost.
In 2020, scoring kicks cost an average of $37,104.70. This time, the Jaguars spent the most per scoring kick ($124.37K), while the Chargers still spent the least (around $8K). However, the cost per kick did increase for some, specifically Josh Lambo of the Jacksonville Jaguars, the kicker with the highest cost per scoring kick, who took in just over $285K per scoring kick attempt in his 2020 season.
Players Earn Their Keep
Fans of football likely don’t consider how much each move costs the team while watching a game, but the team’s finances are largely linked to winning. The more yards gained, kicks scored, defensive plays, and touchdowns made means more wins and less money spent on each. The most value was found with the same combination across all statistics: low salary and high stat. Players with the lowest salaries were largely the players with the most impressive stats and those bringing the team the greatest return on investment.
While there was no clear team that came out on top for the greatest return on investment across all statistics, one thing is for sure: Touchdowns cost the NFL the most money. But investing in touchdowns isn’t just about investing in wins; it’s about investing in the team’s fan base, too. As a team rakes in touchdowns, fan bases become more engaged. At Lines, our goal is to keep fans engaged with their team of choice and the NFL as a whole, from anywhere. To stay up to date with power rankings, trades, and predictions for the season, visit us online at Lines.com.
Methodology and Limitations
NFL player statistic data was mined from Pro Football Reference. NFL player and team salary data were mined from Spotrac. Twelve separate spreadsheets were created based on mined data from these sites for each position of analysis and each year. Data was manipulated in R, where “cost per” statistics were calculated and team salary allocation was validated. The particular salary data that was used was the average annual contract value.
The limitations of this study include the following: limited statistics for the 2020 season (at the time of this data collection) and the inability to isolate starting players (which would require manual separation).
Fair Use Statement
No matter the cost, teams value players for earning their keep, and we value your right to share this study with your audience for noncommercial use. All we ask is that you include a link back to this page so the study’s contributors earn credit for their work.
Our editorial content strives to be highly informative and educational to our audience, especially for visitors who are new or relatively new to analyzing and predicting sporting event results. All of our content is created by informed writers with backgrounds in their subject area and reviewed for omissions or mistakes.
Our editorial team is run by individuals with many years of experience in digital publishing, editorial, and content production. Our editorial content is always marked clearly in any instances where it may be sponsored by a third party, though it is still reviewed by our staff to ensure it remains consistent with our company mission.